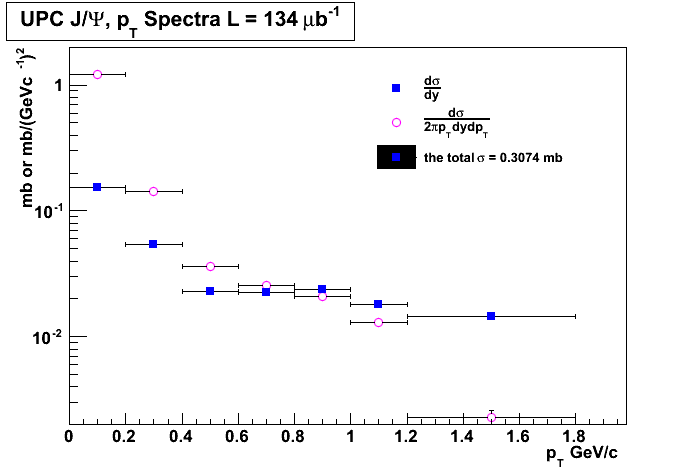
#
#Guillermo Breto Rangel UPC xsection vs root(s)
#
import math
from ROOT import TCanvas, TGraph, TGraphErrors, TF1, TLegend
from ROOT import gROOT
from math import pow
from array import array

gROOT.Reset()

c1 = TCanvas( 'c1', 'A parameter as funtion of \sqrt{s}', 400, 400, 700, 500 )

#c1.SetFillColor( 42 )
#c1.SetGrid()

#n = 3
lumi = 134000
p_T = array( 'd',[0.1, 0.3, 0.5, 0.7, 0.9, 1.1, 1.5] )
yields_dpT = array( 'd',[3062,2989,6050, 2426, 1687] )
dsigma_dy = array( 'd',[20539./lumi,7251./lumi,3062./lumi,2989./lumi,3191./lumi, 2426./lumi, 1734./lumi] )
err_x = array( 'd',[0.1, 0.1, 0.1, 0.1, 0.1, 0.1, 0.3])
err_y = array('d',[167./lumi, 70./lumi, 56./lumi, 56./lumi, 59./lumi, 50./lumi, 42./lumi])

def cross_section(eff, lumi, weighted_jpsi_yield):
    xsection = weighted_jpsi_yield/(eff*lumi)
    return xsection

lumi = 134/math.pow(10,-3)
eff_list = [1, 0.98, 0.95, 0.90, 0.85, 0.80]

weighted_jpsi_yield = round(sum(dsigma_dy),4)*lumi

for i in range(len(eff_list)):
    eff = eff_list[i]
    print "The value of the cross section for "+ eff*100+"% efficiency is "+ str(round(cross_section(eff,lumi,weighted_jpsi_yield),3))+ "mb"


print "the total cross ssection is", round(sum(dsigma_dy),4)
print dsigma_dy
n = len(p_T)
gr_dsigma_pT = TGraphErrors(7)

for i in range(7):
    gr_dsigma_pT.SetPoint(i,p_T[i],dsigma_dy[i]/(2.0*math.pi*0.2*p_T[i]))
    print p_T[i]
    print dsigma_dy[i]/(0.2*p_T[i])
    gr_dsigma_pT.SetPointError(i, 0.1, err_y[i])
    if (i == n - 1):
        gr_dsigma_pT.SetPoint(i,p_T[i],dsigma_dy[i]/(2.0*math.pi*0.6*p_T[i]))
        gr_dsigma_pT.SetPointError(i, 0.3, err_y[i])

gr = TGraphErrors(7)

for i in range(7):
    gr.SetPoint(i,p_T[i],dsigma_dy[i])
    gr.SetPointError(i, 0.1, err_y[i])
    if (i == n - 1):
        gr.SetPoint(i,p_T[i],dsigma_dy[i]/(0.6*p_T[i]))
        gr.SetPointError(i, 0.3, err_y[i])


#gr = TGraphErrors( 7, p_T, dsigma_dy, err_x, err_y )
#gr.SetLineColor( 2 )
gr.SetLineWidth( 1 )
gr_dsigma_pT.SetLineWidth( 1 )
gr_dsigma_pT.SetMarkerColor(6)
gr.SetMarkerColor( 4 )
gr.SetMarkerStyle( 21 )
gr_dsigma_pT.SetMarkerStyle( 24 )

gr.SetTitle( 'p_{T} Spectra' )
gr_dsigma_pT.SetTitle( 'UPC J/#Psi, p_{T} Spectra L = 134 #mub^{-1}' )

gr.GetXaxis().SetTitle( 'p_{T} GeV/c' )
gr_dsigma_pT.GetXaxis().SetTitle( 'p_{T} GeV/c ' )

gr.GetXaxis().SetRangeUser(0, 2)
#c1.SetLogx()
gr.GetYaxis().SetTitle( '#frac{d#sigma}{dy} (#mub)' )
gr_dsigma_pT.GetYaxis().SetTitle( 'mb or mb/(GeVc^{-1})^{2}' )
gr.GetYaxis().SetTitleOffset(1.2)
gr.GetYaxis().SetRangeUser(0, 10)
gr_dsigma_pT.GetYaxis().SetRangeUser(-10, 2)

gr_dsigma_pT.Draw('AP')
gr.Draw("psame")
#gr_dsigma_pT.Draw('same')
c1.SetLogy()

leg = TLegend(0.53,0.63,0.85,0.85)
leg.SetBorderSize(0)
leg.SetFillColor(0)
leg.SetTextSize(0.03)
leg.AddEntry(gr,"#frac{d#sigma}{dy}","P")
leg.AddEntry(gr_dsigma_pT,"#frac{d#sigma}{2#pip_{T}dydp_{T}}","P")
leg.AddEntry(gr, "the total #sigma = "+ str(round(sum(dsigma_dy),4))+" mb")
leg.Draw('same')

# TCanvas.Update() draws the frame, after which one can change it
c1.Update()
#c1.GetFrame().SetFillColor(0)
#c1.GetFrame().SetBorderSize( 12 )
#c1.Modified()
#c1.Update()
c1.Print('UPC_pt_graphlog.png')
c1.Print('UPC_pt_graphlog.pdf')