Invariant mass distributions for topology data and MC &rho0 candidates with
varied track cuts.
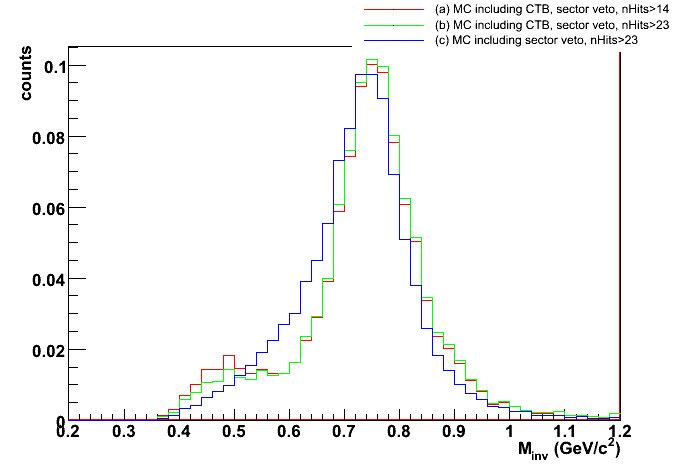
Invariant mass distributions are plotted below for the topology MC
&rho0 candidates. For the curves cuts have been
changed (as indicated below) to investigate the possibility of track splitting.
Figure 1:
Invariant mass histograms for MC topology &rho0 candidates
(normalized to have an area of 1
for comparison):
- including CTB, sector veto, nHits > 14 (red)
- including CTB, sector veto, nHits > 23 (green)
- including sector veto, nHits > 23 (red)
 |
Figure 2:
Invariant mass histograms (normalized to have an area of 1
for comparison) for :
- topology data &rho0 candiates (black),
- topology MC &rho0 candidates including CTB, sector veto, nHits > 14 (red)
 |
| Curve Name | CTB (helix) | nHits | Sector Veto | Counts | Events |
| (a) | x | >14 | x | - | 400,000 |
| (b) | x | >23 | x | - | 400,000 |
| (c) | - | >23 | x | - | 400,000 |
| (d) | - | - | x | - | - |
| (e) | x | >14 | x | - | 400,000 |
Explanation of column headings in table:
- CTB (helix) - indicates whether track &pi+ &pi- pairs
have been excluded if one or both fall outside of the CTB acceptance.
- nHits - number of hit points required to reconstruct a track.
- Sector Veto - indicates whether condition of UPC topology data trigger has
been applied, as explained here
- Counts - number of counts in the plotted spectrum before normalization.
- Events - number of &rho0 candidates generated in STARlight before
simulation and reconstruction.