Comparison of MC rho candidates with and without topology trigger veto.
The UPC Topology trigger utilized the Central Trigger Barrel divided into four
quadrants. It required at least one track in the north and south quadrants;
the top and bottom quadrants were used as vetos, to reject cosmic rays.
Figure 1:
Plot of invariant mass distrubution for the MC &rho candidates without trigger calculation
included (blue histogram) and data (red histogram). Histograms have been normalized to have an area of 1 for comparison.
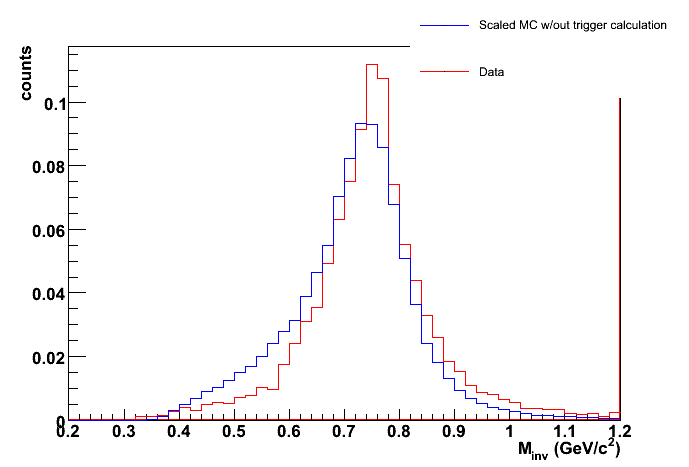 |
Figure 2:
Plot of invariant mass distrubution for the MC &rho candidates with trigger calculation
included (black histogram) and data (red histogram). Histograms have been normalized to have an area of 1 for comparison.
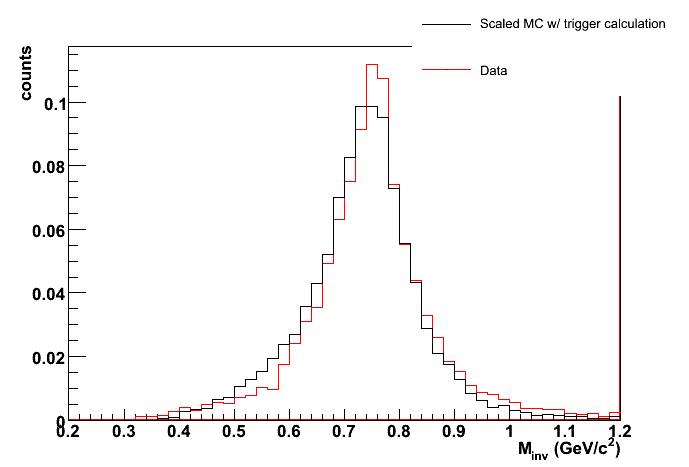 |
Figure 3:
Comparison of mass distribution for data (red histogram), Monte Carlo with (black histogram) and without (blue histogram) trigger calculation. Histograms have been normalized to have an area of 1 for comparison.
 |
Figure 4:
Ratio of mass distributions - Monte Carlo with trigger calculation to data. Guideline at ratio = 1 has
been drawn.
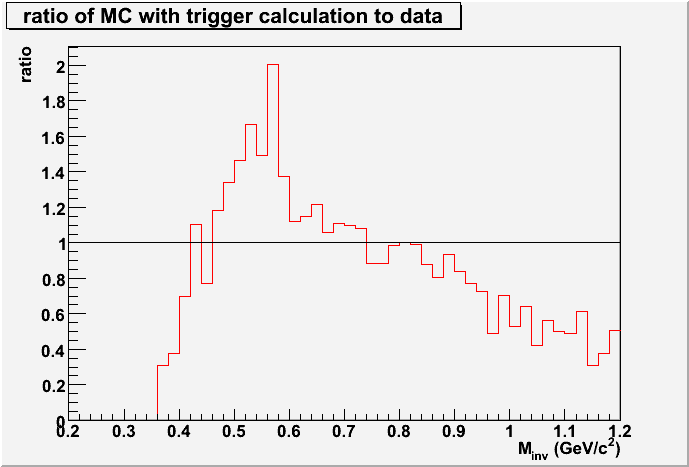 |
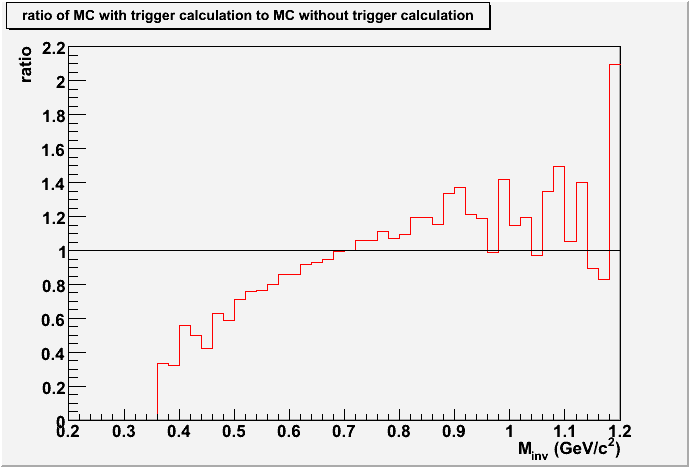
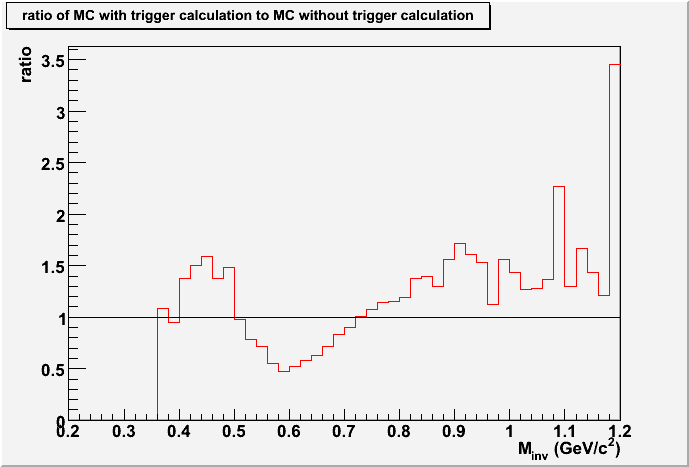
Figure 5:
Ratio of mass distributions - Monte Carlo with trigger calculation to Monte Carlo without trigger
calculation. Guideline at ratio = 1 has
been drawn.
 |
Variation of Veto Quadrants
The size of the north and south quadrants has been varied from a size of &pi/3.8
to a size of &pi/3.0 in the following plots to observe the effect on the
invariant mass of the reconstructed &rho's.
Figure 6:
Plot of invariant mass distribution for North/South sector size of &pi/3.8.
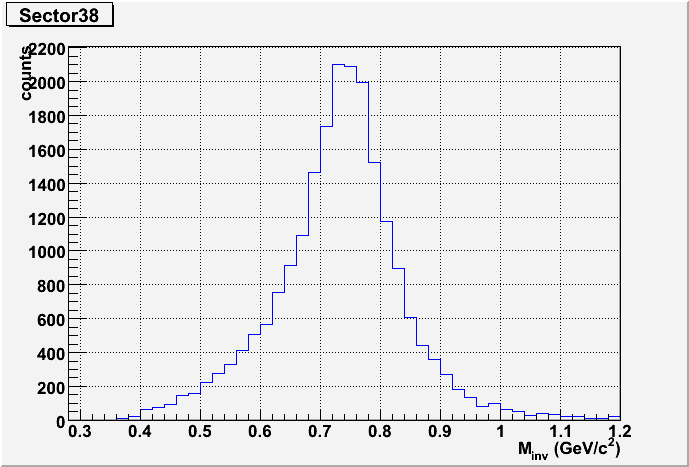 |
Figure 7:
Plot of invariant mass distribution for North/South sector size of &pi/3.6.
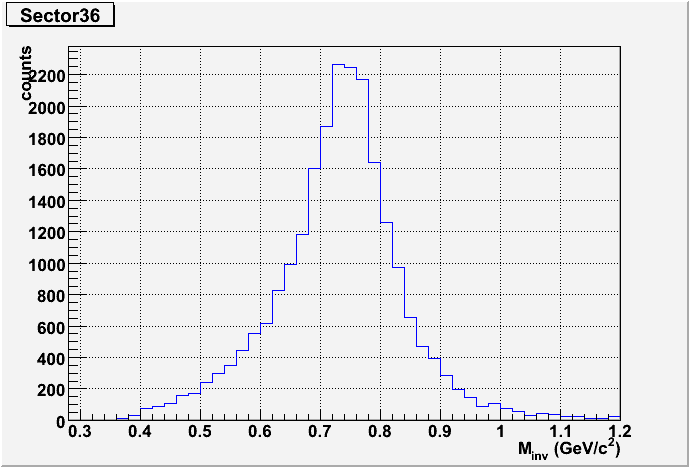 |
Figure 8:
Plot of invariant mass distribution for North/South sector size of &pi/3.4.
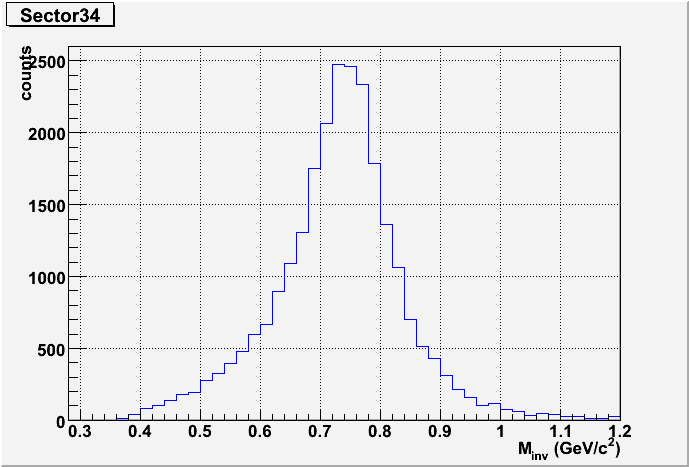 |
Figure 9:
Plot of invariant mass distribution for North/South sector size of &pi/3.2.
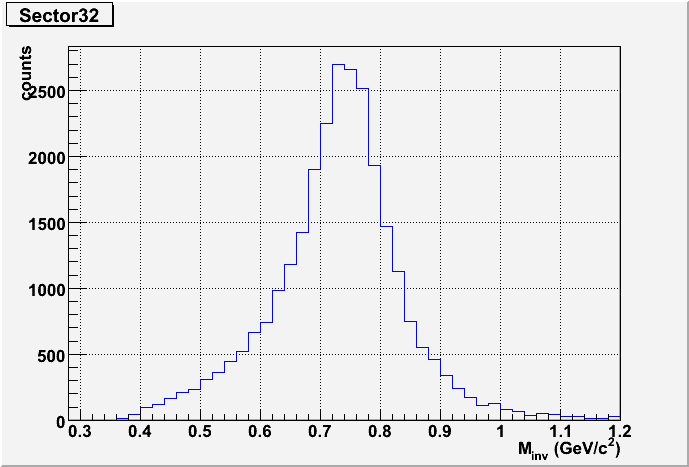 |
Figure 10:
Plot of invariant mass distribution for North/South sector size of &pi/3.0.
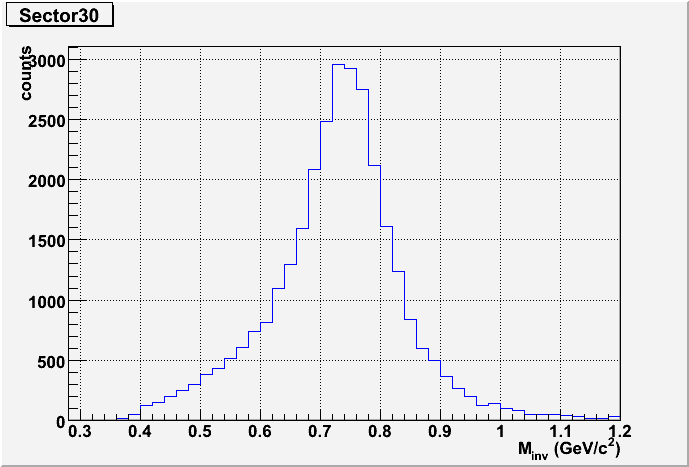 |
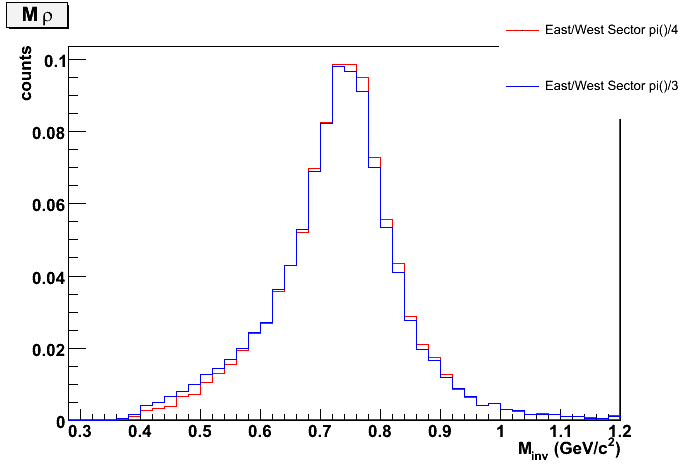
Figure 11:
Comparison of mass distribution for different North/South sector sizes. Red histogram is &pi/4.
Blue histogram is &pi/3. Histograms have been normalized to have an area of 1 for comparison.
 |
Comparison of MC rho candidates with and without trigger simulation with new B/A ratio
The B/A ratio determines the admixture of direct pions produced to photoproduced
&rho mesons. In STARlight the ratio is set to 0.67. Yury's current measurment is 0.89.
So, I changed the B value in STARlight to get the ratio to match the current measured value. I ran
100,000 events in STARlight. (B and A are measured quantities in this equation.)
Figure 12:
Plot of invariant mass distrubution for the MC &rho candidates with trigger calculation
included (black histogram) and data (red histogram). Histograms have been normalized to have an area of 1 for comparison.
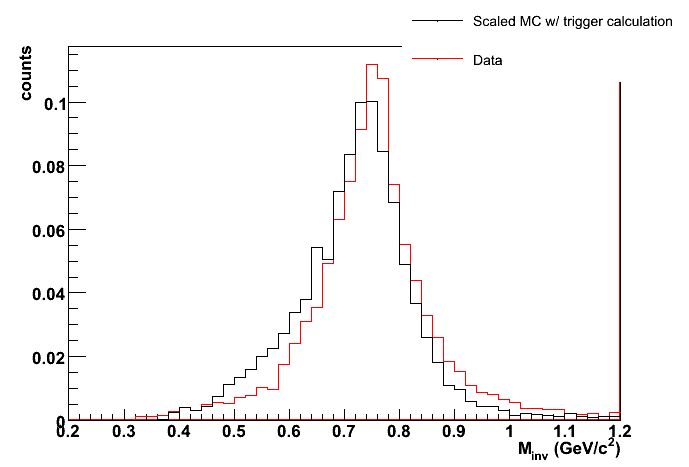 |
Figure 13:
Comparison of mass distribution for data (red histogram), Monte Carlo with (black histogram) and without (blue histogram) trigger calculation.
Histograms have been normalized to have an area of 1 for comparison.
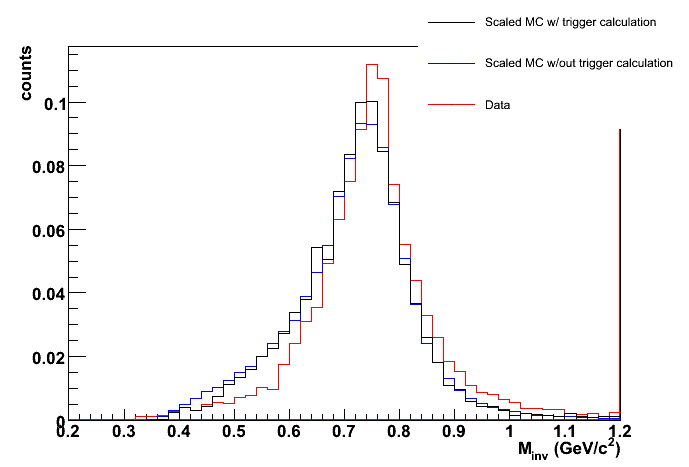 |
Figure 14:
Ratio of mass distributions - Monte Carlo with trigger calculation to data. Guideline at ratio = 1 has
been drawn.
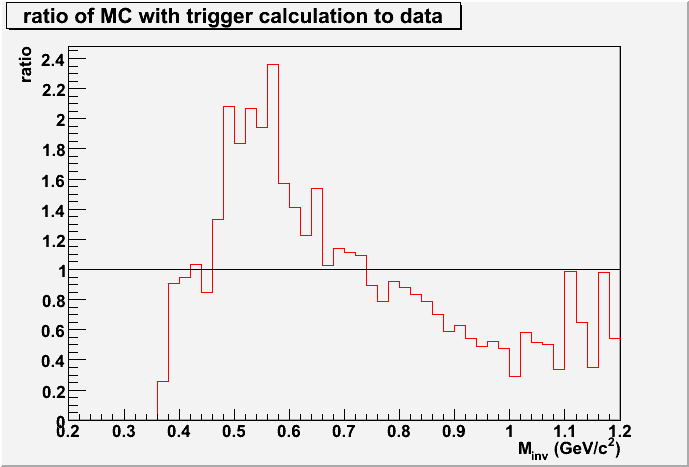 |
Figure 15:
Ratio of mass distributions - Monte Carlo with trigger calculation to Monte Carlo without trigger
calculation. Guideline at ratio = 1 has
been drawn.
 |
Comparison of MC rho candidates with and without trigger simulation including
CTB acceptance.
Depending on the zVertex of the produced &rho, for a given &eta it may or may not
fall within the acceptance of the CTB. We include this effect in the trigger calculation.
Figure 16:
Plot of invariant mass distrubution for the MC &rho candidates with trigger calculation
included (red histogram) and data (black histogram). Histograms have been normalized to have an area of 1 for comparison.
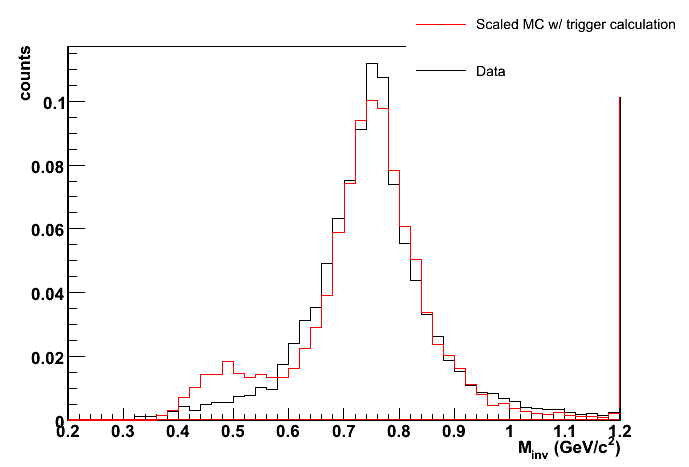 |
Figure 17:
Comparison of mass distribution for data (black histogram), Monte Carlo with (red histogram) and without (blue histogram) trigger calculation.
Histograms have been normalized to have an area of 1 for comparison.
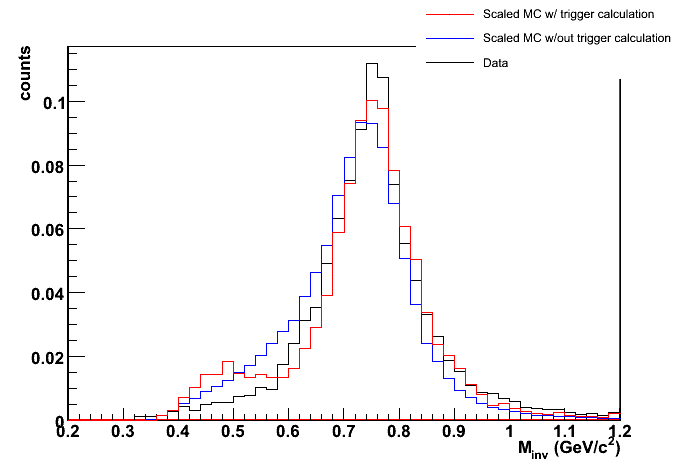 |
Figure 18:
Ratio of mass distributions - Monte Carlo with trigger calculation to data. Guideline at ratio = 1 has
been drawn.
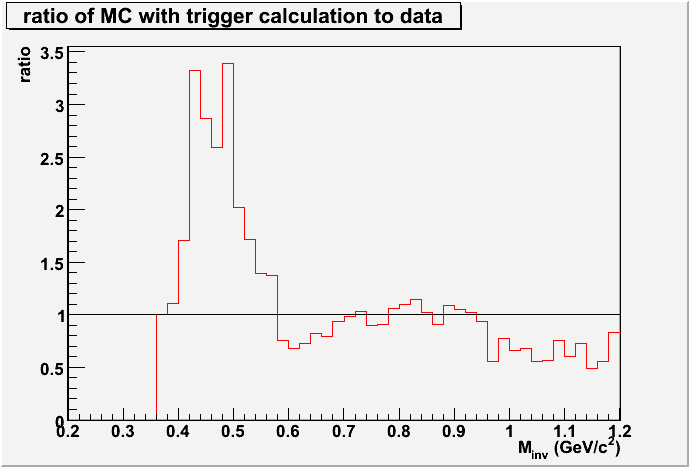 |
Figure 19:
Ratio of mass distributions - Monte Carlo with trigger calculation to Monte Carlo without trigger
calculation. Guideline at ratio = 1 has
been drawn.
 |


