Random Cluster Subtraction
Random Cluster Subtraction
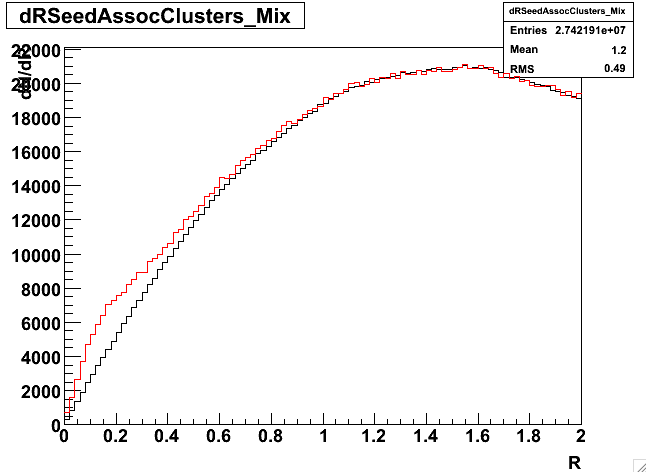
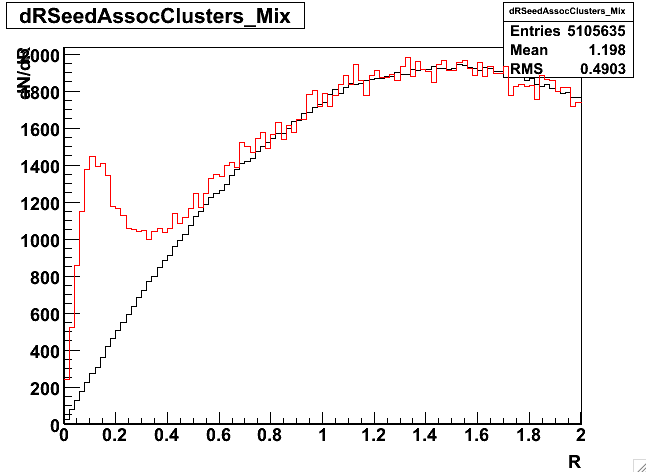
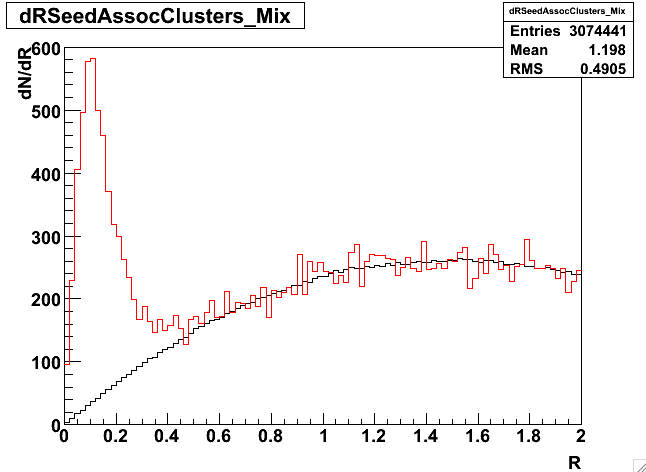
The histograms below show the radial distance
(&radic(&Delta&eta2 + &Delta&phi2)) between primary seed and
associated tracks in data (red) and mixed events (black) histograms.
For the mixed event background, a primary seed is taken from an event and mixed with
associated tracks from other events.
dN/dR - minimum secondary seed - 2.0 GeV
Because of the relatively low secondary seed cut,
there are a good number of random clusters (black histogram) as background.
 |
dN/dR - minimum secondary seed - 3.0 GeV
Increasing the secondary seed cut
definitely enhances the signal (red histogram)
over the random clusters (black histogram).
 |
dN/dR - minimum secondary seed - 4.0 GeV
The signal (red histogram)
is further enhanced over the random clusters (black histogram)
by increasing the secondary seed cut from 3 to 4 GeV.
 |
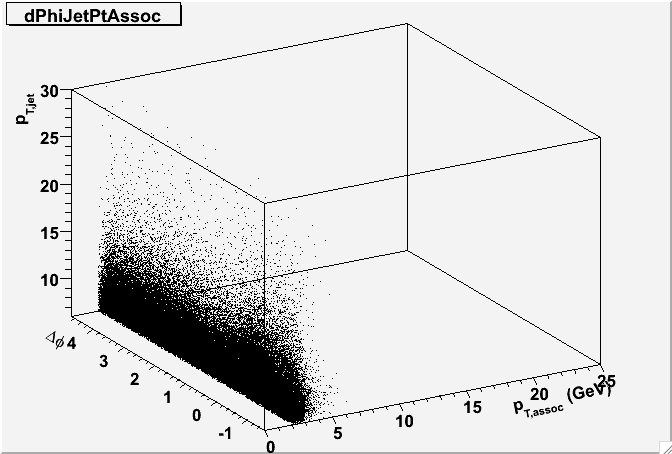
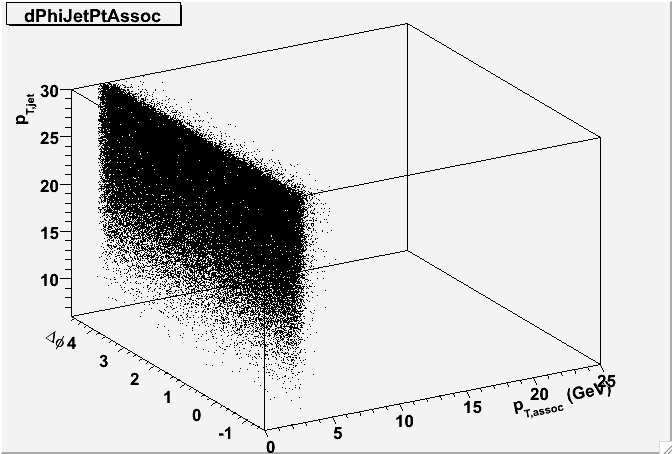
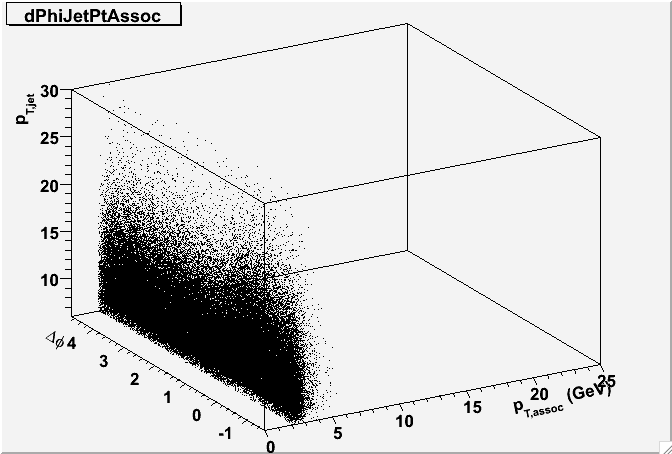
The distribution of multi-hadron triggers as a function of pT,jet
pT,associated, and &Delta&phi . The plot on the left is for
secondary seed tracks with an R < 0.3. The plot in the middle is for
secondary seed tracks with 0.8 < R < 1.2. The plot on the right is for
secondary seed tracks with 0.8 < R < 0.845.
 |
 |
 |