Figures 1-7
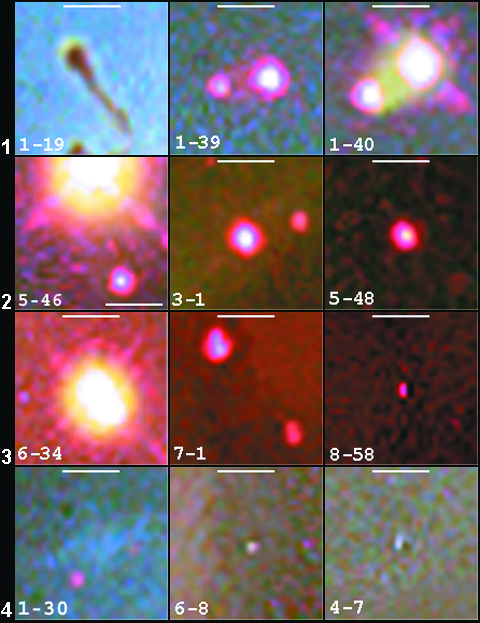
Figure 1. Resolution power of the Hubble image and comparative angular
dimensions. All box images have the same angular amplification. The top
bars indicate 1 arcsec in each box. The objects without strong glare (no
shine or glow) have an observed angular diameter.
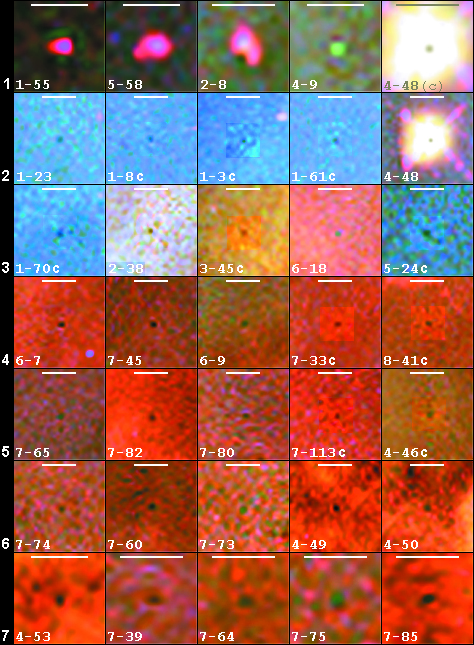
Figure 2. Isolate dark giants. Line 1 are aligned giant objects, binary
systems and partial eclipses between red giants (boxes 1-55 and 5-28) The
most interesting boxes, 2-8 and 4-48, reveal partial eclipses where one
dark giant is seen transiting over an attenuated supergiant cocoon and the
other, a bright star. The angular sizes of dark giants are ~0.2 to ~0.1
arcsec (lines 2 to 7). They present different morphologies in line 7.
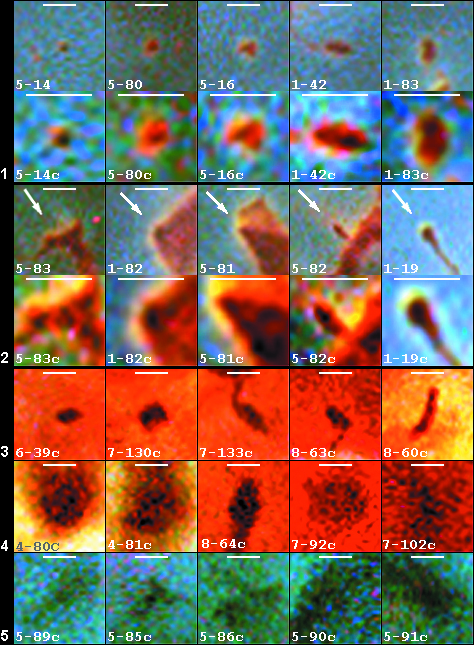
Figure 3. Dusty globules in Carina region. Typical globules of lines 1 and
2 are in original and contrasted images. The contrasted image highlights
internal dark giants. Globules of line 2 show the incident ionizing
radiation that smoothly displaces the gas and dust in the arrow direction
also revealing an internal dark giant complex. Isolate conglomerates of
dark giants associated with the Carina nebula in lines 3 and 4. Each
individual conglomerate contains a large number of dark giants that are
embedded in the largest, darkest and extended dusty globules. Line 4 shows
denser conglomerates. Larger conglomerates (line 5) are also close the
nebula.
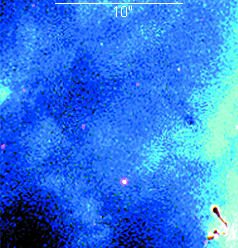
Figure 4. Conglomerates of dark giants. Zone A of Figure 7. This Zone
shows dark giants that are fully free of the dense part of the Carina
nebula.
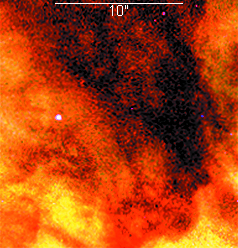
Figure 5. Association of conglomerates. Zone B is an extensive area of
dark giants associated with the Carina nebula.
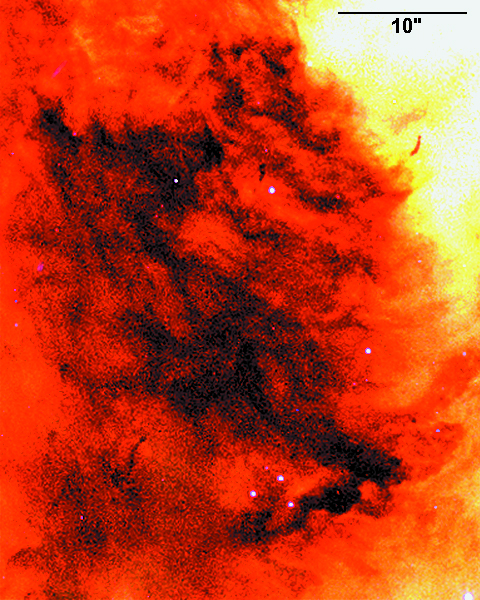
Figure 6. A Union of Conglomerates of dark giants. The Union U1 is a large
zone of conglomerates associated with the darkest sector of Carina nebula.
The embedded dark giants are noticeable when a high contrast is applied.
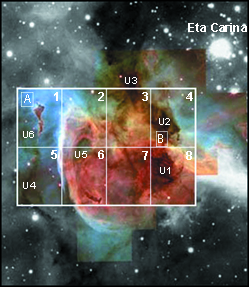
Figure 7. The Carina Nebula. A color photographs mosaic of Carina nebula
taken by the Hubble Space Telescope in 1999. The Hubble Image (rectangle)
presented here is divided into 8 sectors. The small frameworks A and B are
zones amplified in Figures 4 and 5 respectively. The attenuated stellar
objects are invisible at the scale of this image.