Star Analysis page
Analysing Proton Background
In order to determine the amount of the proton background during events, proton and antiproton histograms of distance of closest approach (DCA) were used.
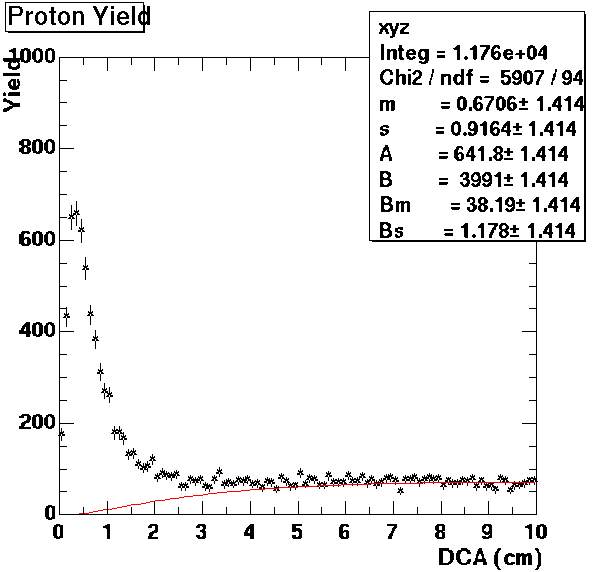
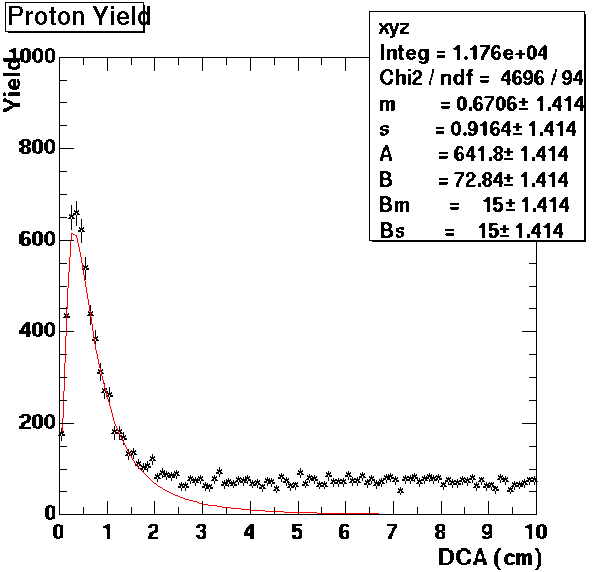
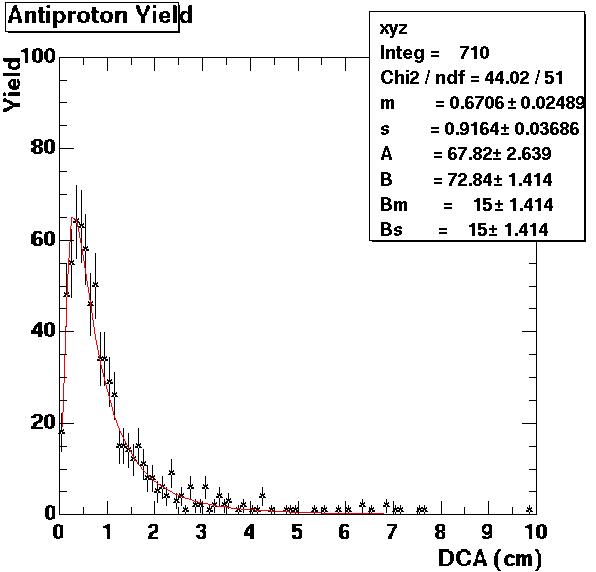
First both were examined over a range of DCA from 0 to 10 cm. Assuming that both the pr+ and pr- had similar distribution, a lognormal distribution was found to be a good fit for both the pr- and the spike in the pr+.
The lognormal distribution has the functional form of: A*exp(-.5(ln(x/m)/s)^2)/(x*s*(2PI)^.5)
where m and s are affect the shape of the distribution and A is an arbitrary amplitude parameter than is dependent on the binning used in the histogram. The values of m and s used came from a best fit of the lognormal to the antiproton histogram and used for both since they presumably should have the same shape.
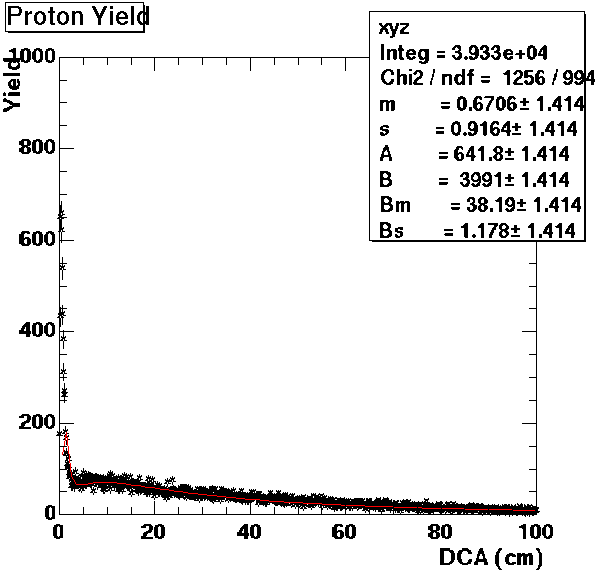
Next attempted was to fit a function to the remaining background of the protons and so determine the amplitudes of both the background function and the proton lognormal distribution. However at 0-10 DCA the background appears to have a constant value so the histogram over a range of 0-100 DCA was examined. This yielded a tail for the background as well as a small hump near the main spike. A lognormal distribution was then tried to see how well it fit this background.
| Histogram 0 - 100 |
Histogram 0 - 10 |
Background function only |
 |
 |
 |
Looking at the range 0 - 3 DCA where we had put the cut on DCA, these functions yielded a predicted amount of 6087 fireball protons and 615 background protons for a total of 6702 protons. Actual production from 0 - 3 was 6749. So the prediction from these functions is within 1% of measured. The resulting percentage of protons from 0-3 predicted to be background is 9%. Also to be considered is the tail of fireball protons which lies outside of 0-3 range. The predicted amount of those is about 330


