for an event with a given impact paramiter using only collision geometry and a nucleus density distribution.
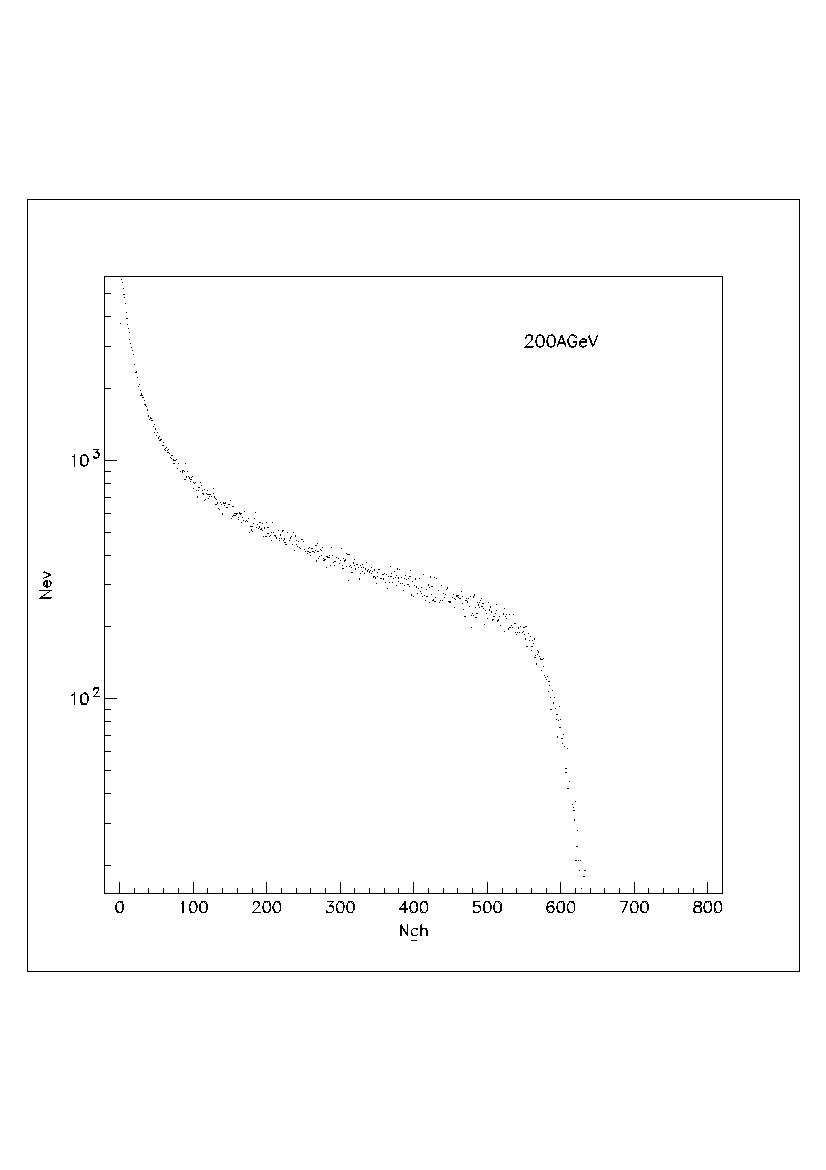
To support my model I generated a scatter plot to match the
200 AGeV Au+Au Nev vs Nch plot
To relate my model's data to the experimental data I use the reations
Nevtot=Ls and Nch=a*Npar
where L is the integrated luminosity, s is the inelastic reaction cross section and I have assumed a to be constant as in the wounded nucleon model
(ie. after a nucleon's first collision it becomes excited and it's cross section is reduced considerably. The Glauber model, being purely geometric, has no way of including this effect, so Nch should scale more like Npar from the model then Ncol from the model)
Using these relations
Nev = dNevtot/dNch = L*ds/dNch = L*ds/(a*dNpar)
I used the relation ds=2(pi)b*db to generate the following plots. (maybe not a good relation). Also, since I do not know L or a, I scale each axis of my ds/dNcol vs Ncol plot by an arbitrary number (different number for each axis)to match the experimental data best. (the scaling factor on the abscisa axis should give me a, the scaling factor on the ordinate axis gives L/a and thus the integrated luminosity L)
Results
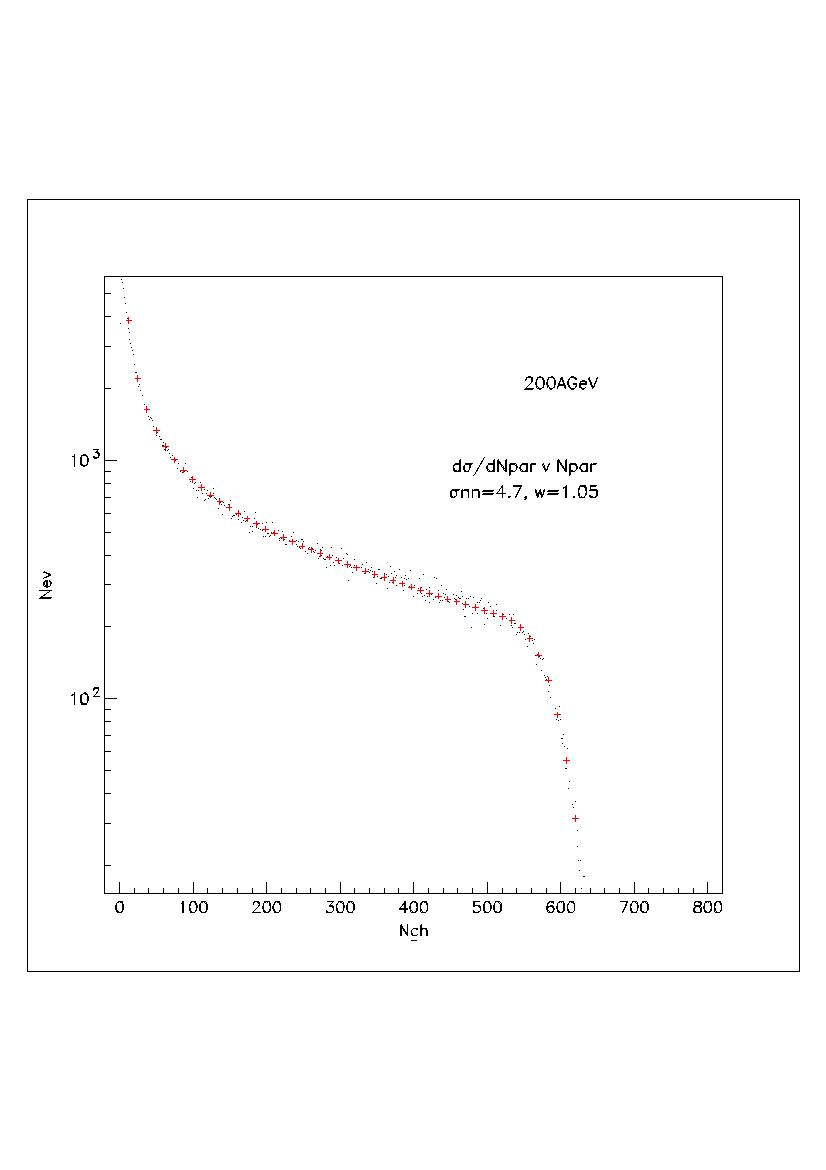
This plot is insufficitent because it does not take into account that at a given impact paramiter there are a spread of possable Nch. This spread is assumed to be Gaussian in shape with the number generated by the Glauber model as it's centroid
P(Nch;b)=(2(pi)wNpara2)-.5*exp[-(Npar-Nparave)/(2wNparave)]
note that P is a probability density and that Nparave is a function of b
ds/dNch=
 P(Nch;b)2(pi)b*db
 I do not uinderstand how this is true other than that multiplying both sides by dNch and integrating over dNch gives
s=
2(pi)b*dbUsing this agorithm I have obtained a good fit.
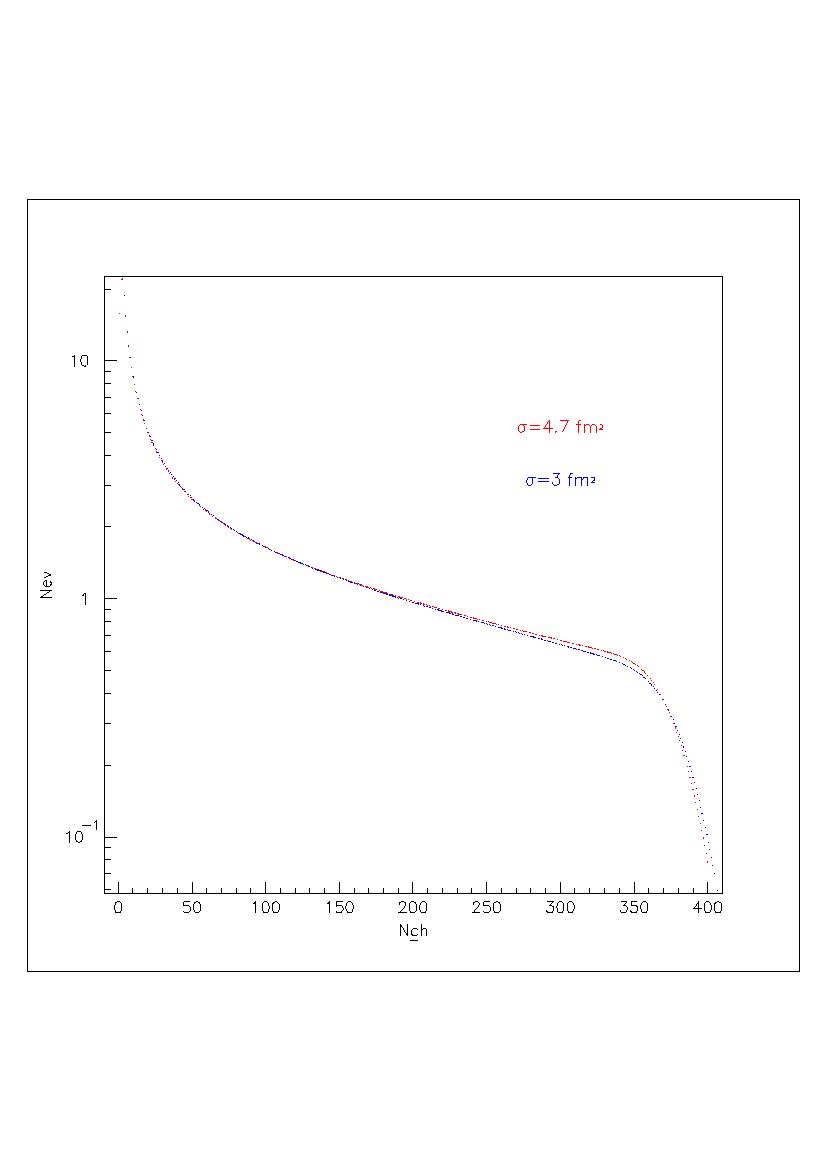
An interesting observation I have made is that according to my model, the shape of the Nch disrtibution is changed by changing the nucleon-nucleon cross section (ie the shape changes with beam energy)
This plot is scaled arbitrarly so that one can see the differences in shape.
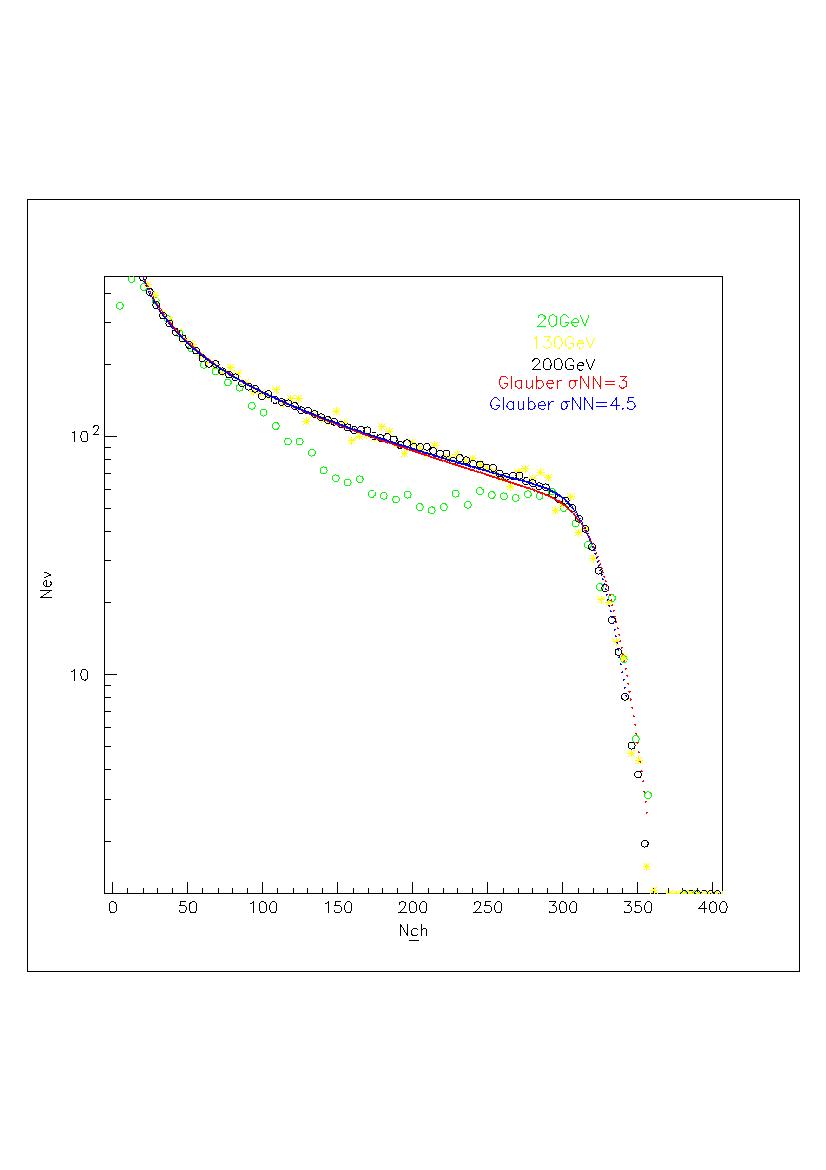
This plot shows a comparison of the differences in shape to the experimental data for 20, 130, and 200 GeV. The cross section of 3 was chosen arbitrarly, but is reasonable for these energies.
This plot shows the difference in shape of Nch distributions for the sigma NN values corresponding to 20 and 200 gev (3.8 and 5.3 respectively).
Questions:
I want to see a derivation of the formula
Npar=
A*TA{1-[1-sTB]B}
+ B*TB{1-[1-sTA]A}d2s
and justification for [1-sT]A =~ e-sT
and for
ds/dNch=
P(Nch;b)2(pi)b*db Notes:
Increasing w makes the generated point more resemble y=-x
Increasing snn makes the max number of participants increse slightly, and moves the "dive point" on the right toward the left