Delta Phi Correlations
Mixed Event &Delta&phi Correlations
The &Delta&phi correlation plots below have been generated
with a rotating stack of 10 events grouped by zVertex bin (12 bins from
-30 to 30 cm), 24M events have been run over.
The &phi from a seed in the current event is taken
and compared to &phi values from associated tracks of 10 other events
kept in an array.
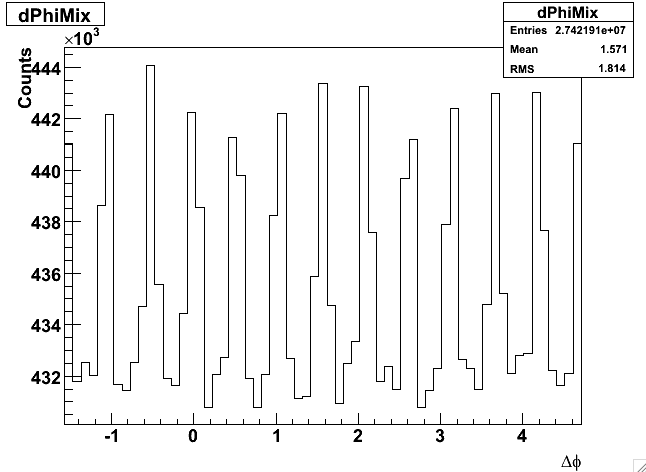
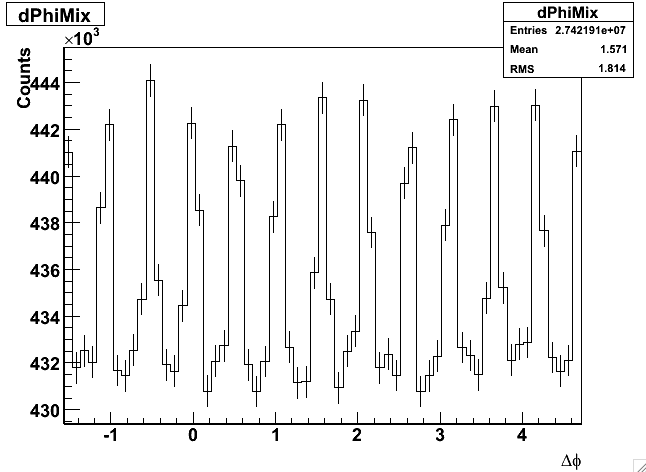
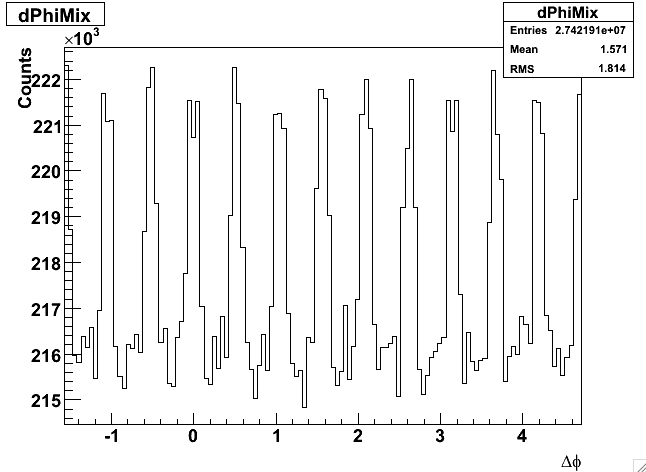
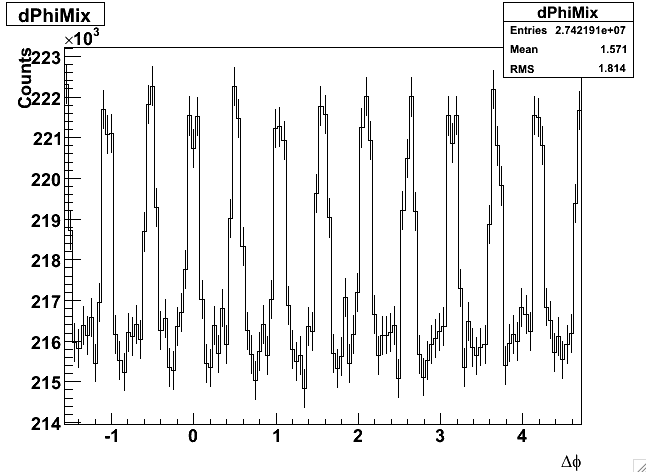
&Delta&phi Correlations - 48 bins -
with errors
The repetitive peak structure
is consistent with the effect of endcap sector boundaries.
 |
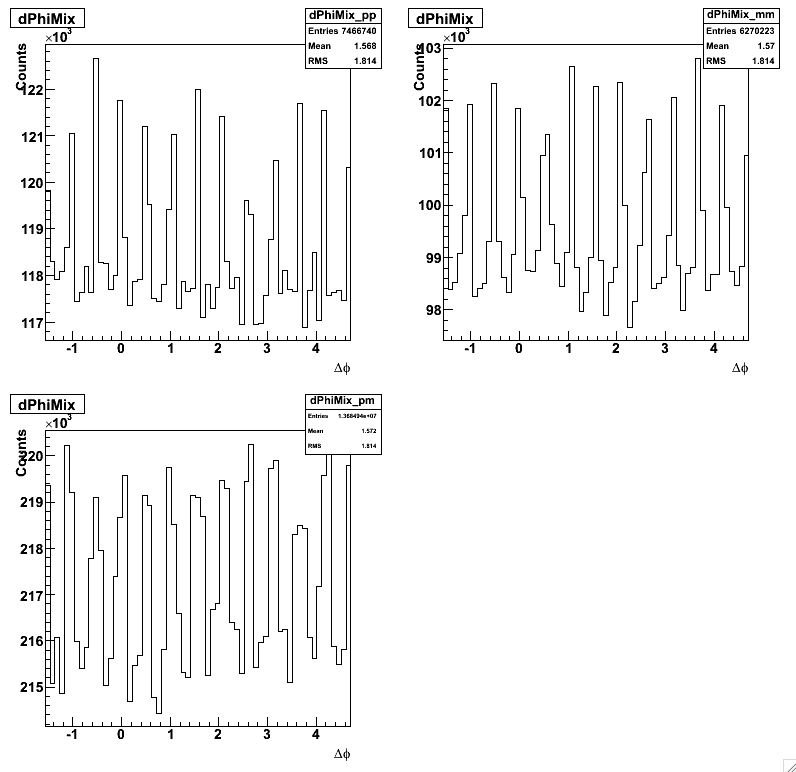
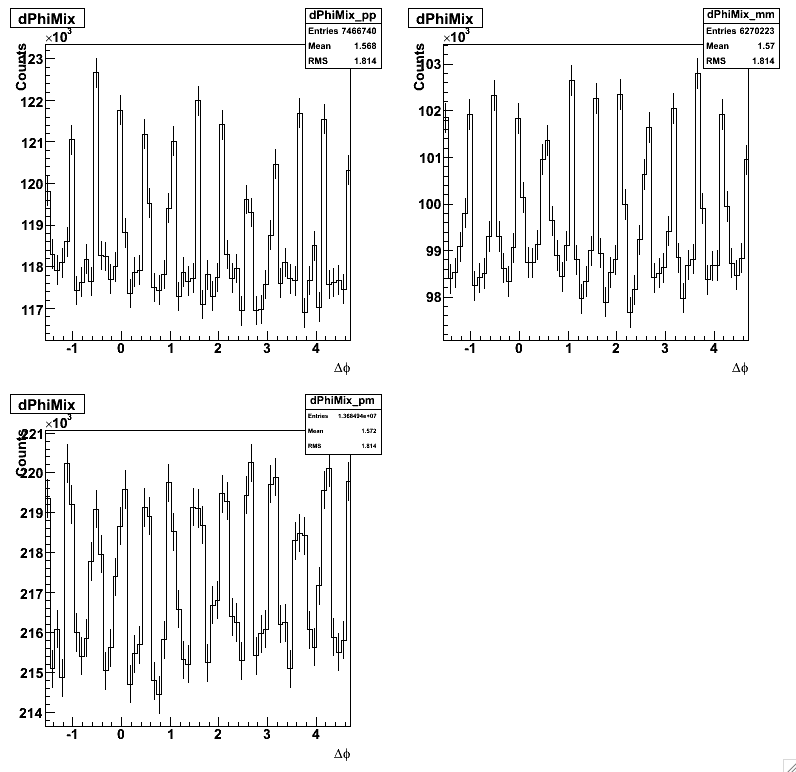
&Delta&phi Charged Separated Correlations - 48 bins -
with errors
As a systematic check on the correlations, they are sorted
by charge:
TOP LEFT -> ++, TOP RIGHT -> --, BOTTOM LEFT -> +-
 |
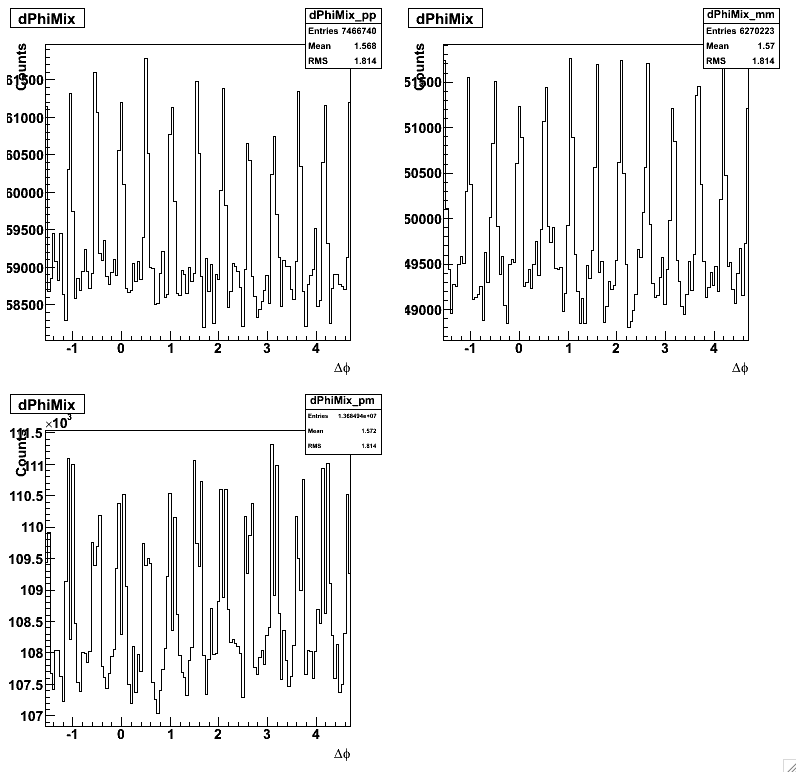
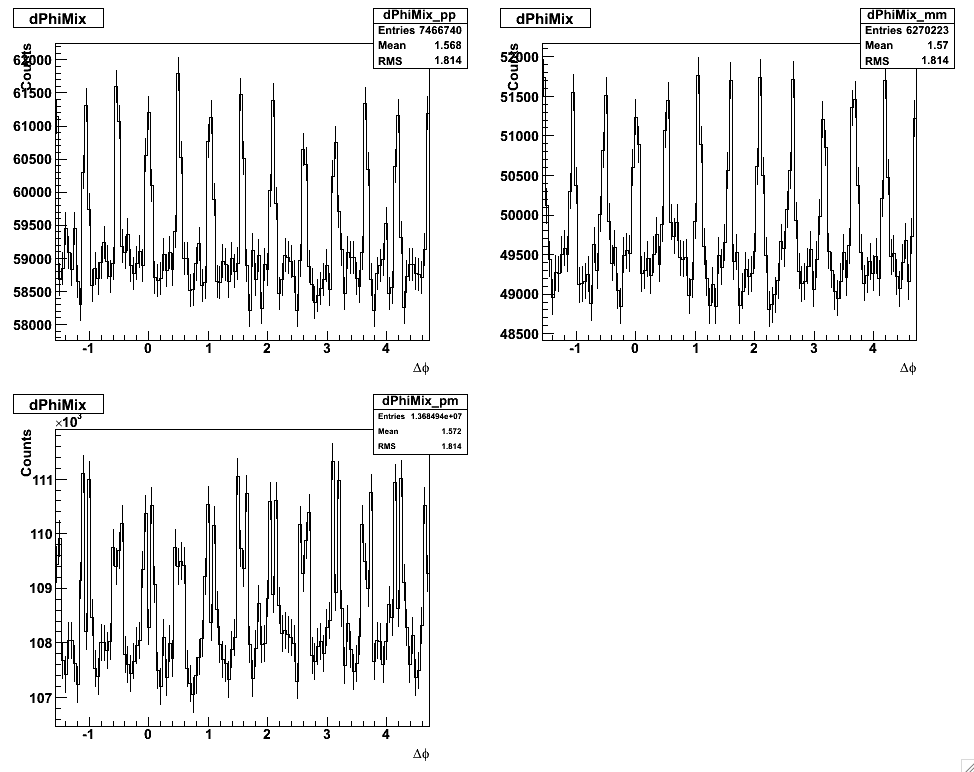
&Delta&phi Charged Separated Correlations - 126 bins -
with errors
As a systematic check on the correlations, they are sorted
by charge:
TOP LEFT -> ++, TOP RIGHT -> --, BOTTOM LEFT -> +-
There's a dip at zero in the +- correlations not seen in the ++ or --
correlations.
 |