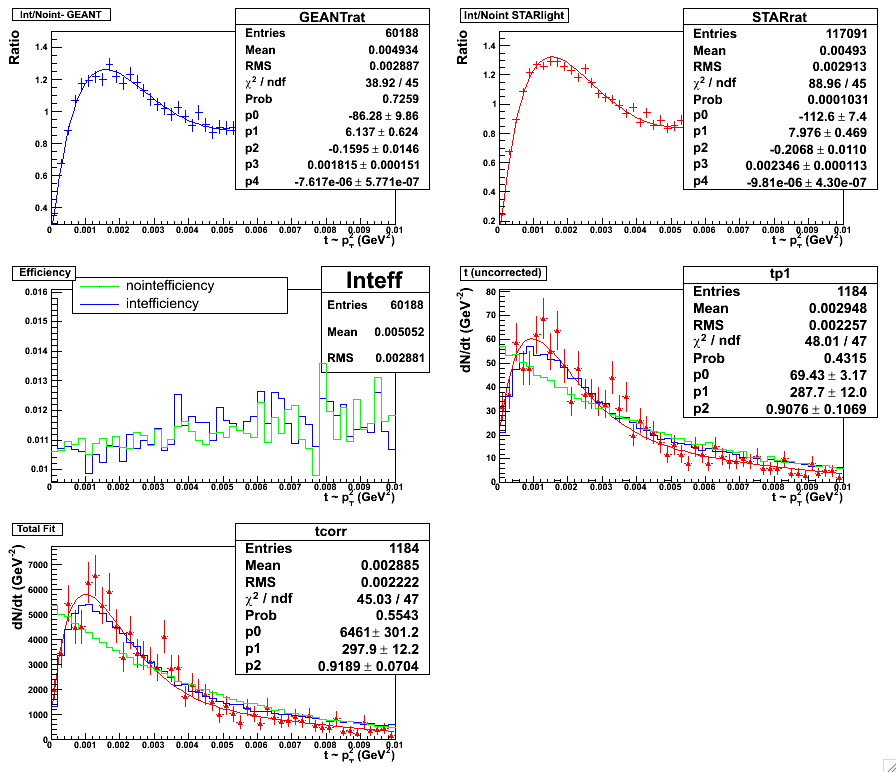
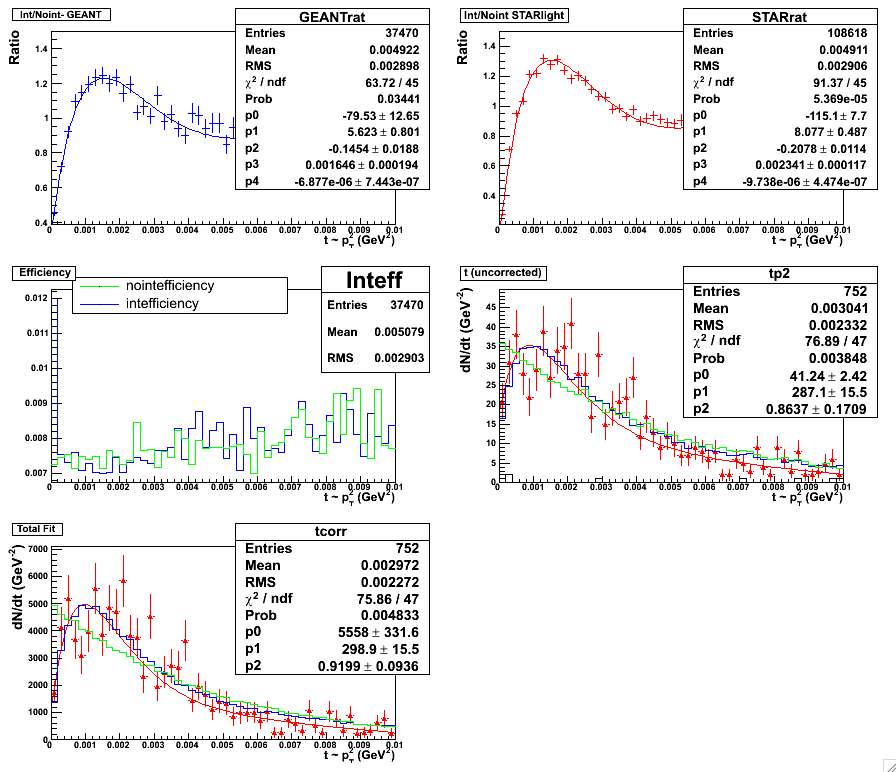
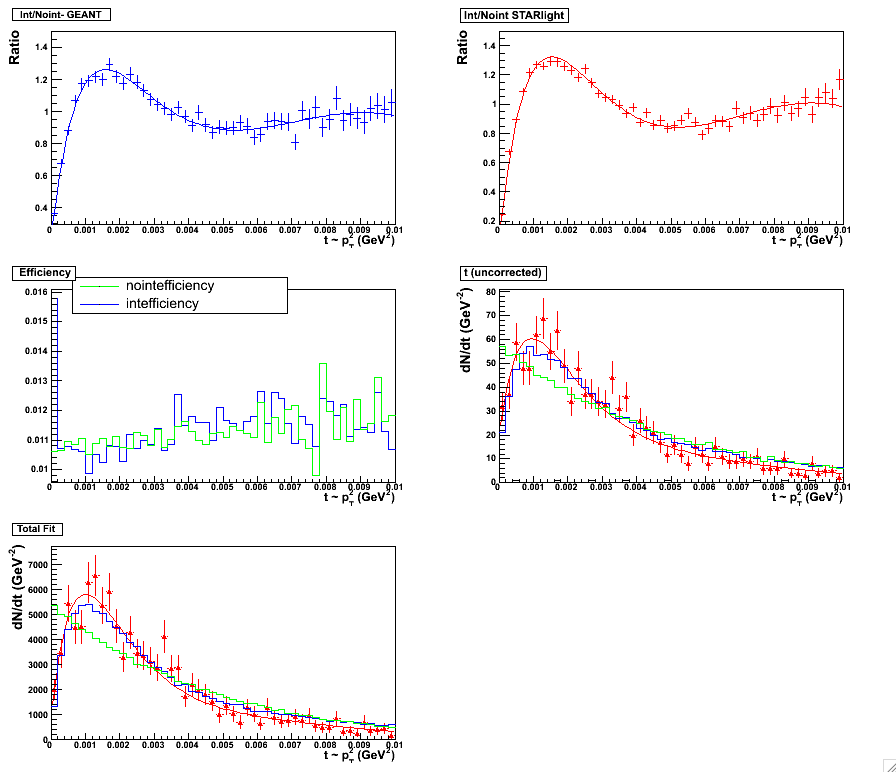
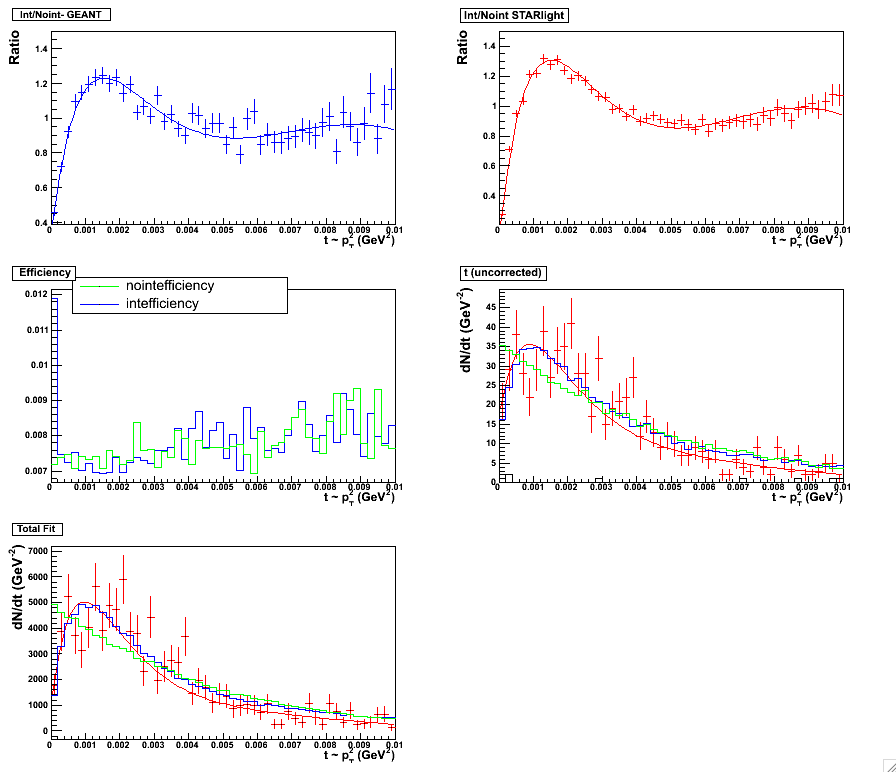
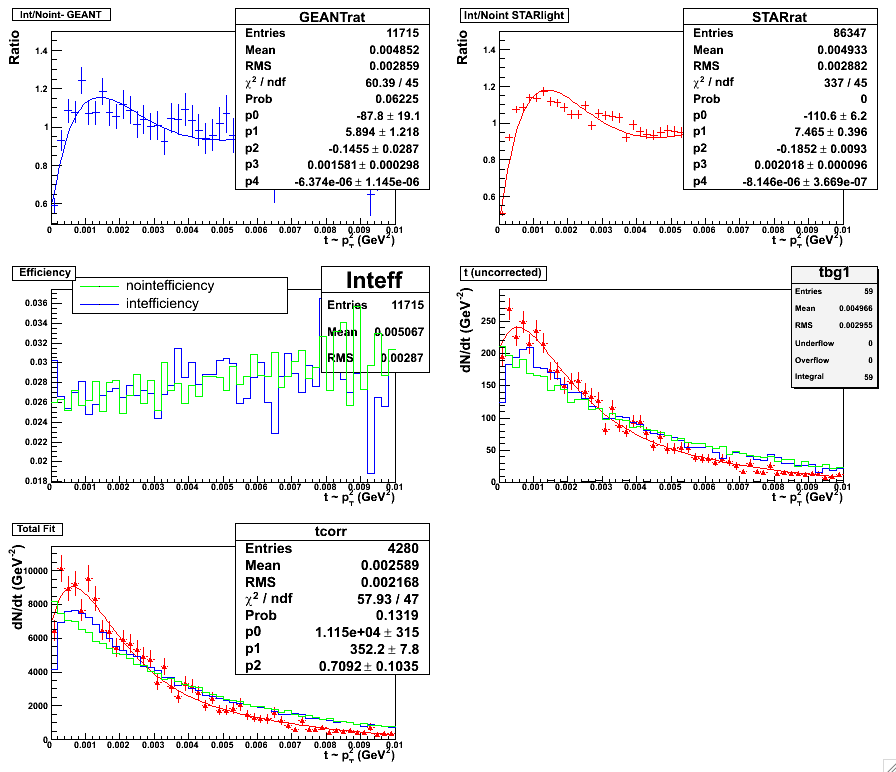
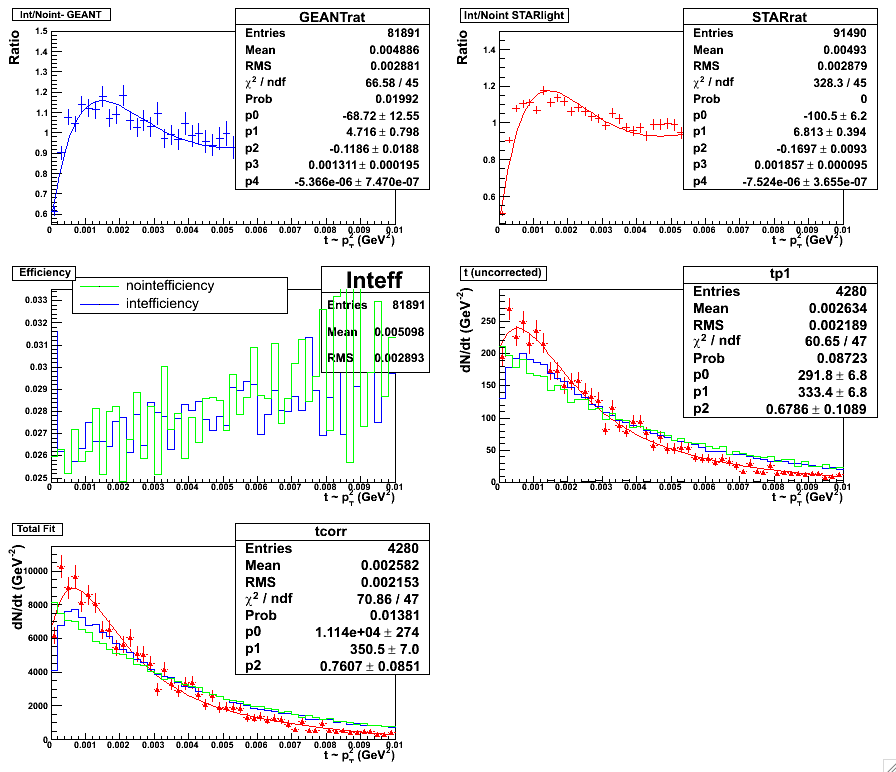
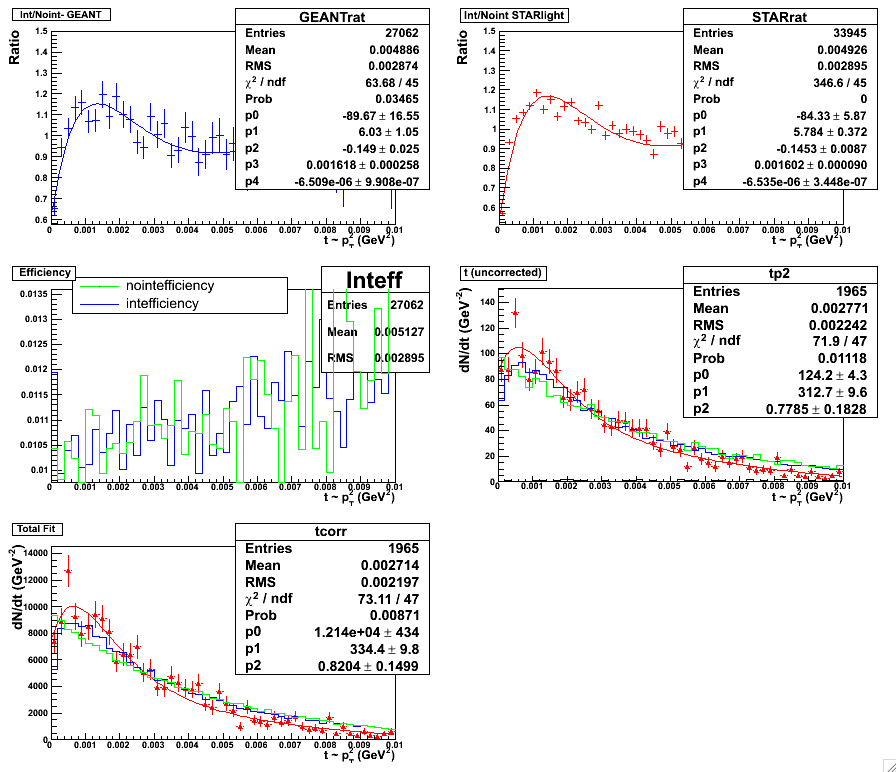
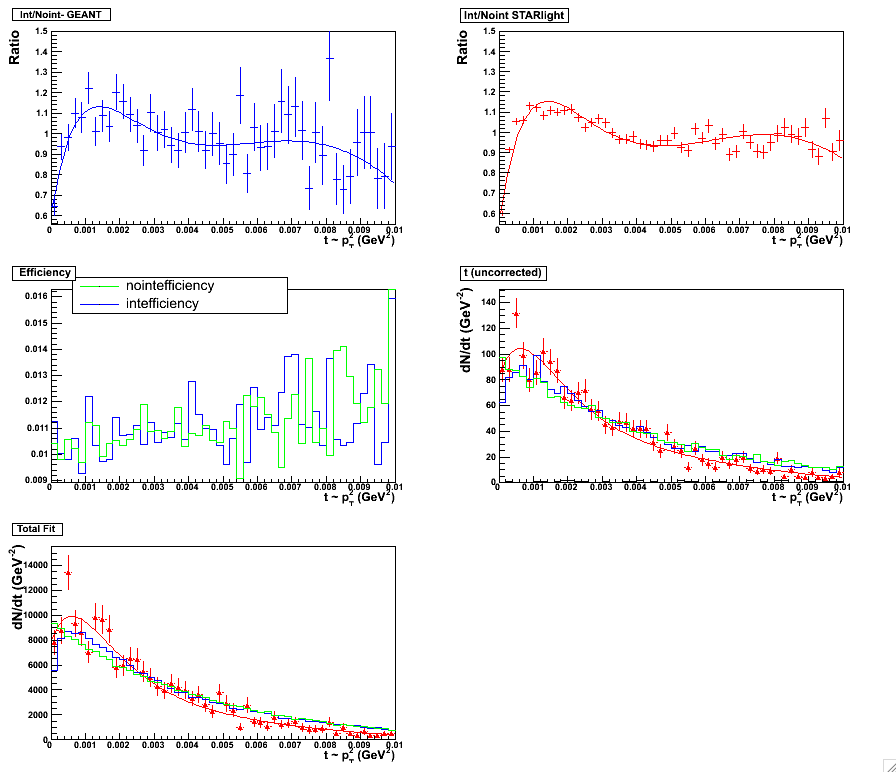
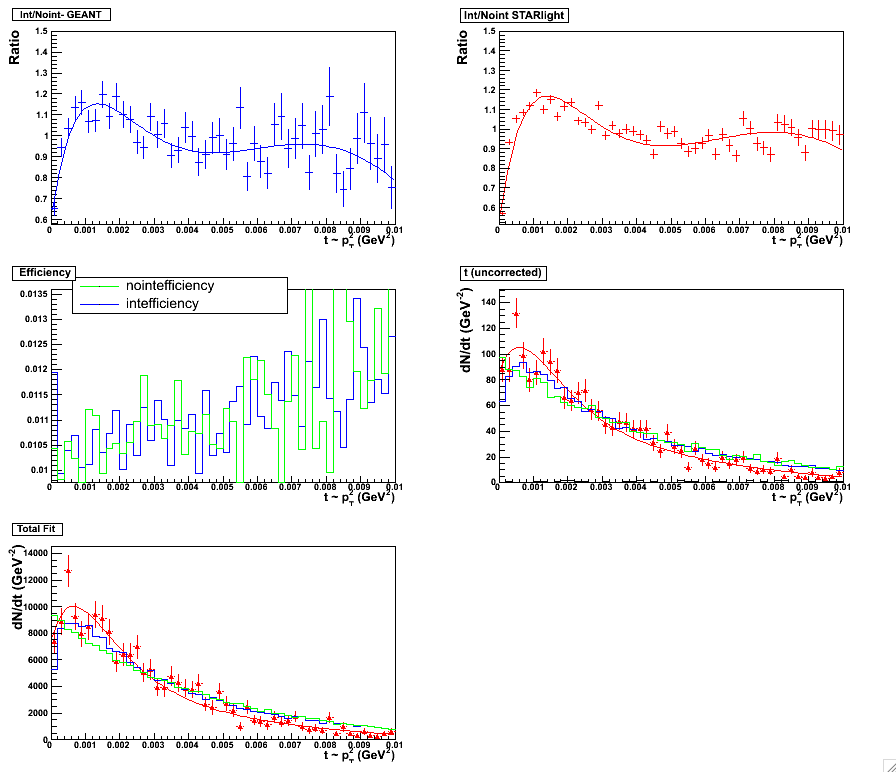
We rerun the analysis with the requirement that pairs be unlike-sign removed (so called plots 'with background')
and note how much doubling the background affects the results. The plots are presented with and without statistics boxes.
0.0 < y < 0.5 no background |
0.0 < y < 0.5 with background |
0.5 < y < 1.0 no background |
0.5 < y < 1.0 with background |
0.0 < y < 0.5 no background - no stats |
0.0 < y < 0.5 with background - no stats |
0.5 < y < 1.0 no background - no stats |
0.5 < y < 1.0 with background - no stats |
0.005 < y < 0.5 no background |
0.005 < y < 0.5 with background |
0.5 < y < 1.0 no background |
0.5 < y < 1.0 with background |
0.005 < y < 0.5 no background - no stats |
0.005 < y < 0.5 with background - no stats |
0.5 < y < 1.0 no background - no stats |
0.5 < y < 1.0 with background - no stats |